How I did it.
For this project, I was tasked with building a k-Nearest Neighbors algorithm from scratch.
What is k-Nearest Neighbors?
k-Nearest Neighbors is what is called “lazy” machine learning,
as no learning is actually done.
A k-Nearest Neighbors model just remembers the input data,
and then when the predict method is called,
it checks the distance between the input points and every point in the input data,
returning the majority class from the k closest points
(hence k-Nearest Neighbors).
How it’s made
My main references for this project were this article and this Geeks for Geeks page.
I used the libraries pandas and numpy, so we’ll start with the import statements.
import numpy as np
import pandas as pd
I wrote a simple Euclidian distance function using NumPy’s matrix multiplication. The parameter is just optimization. This is the default value for the distance formula.
def distance(pointA, pointB, _norm=np.linalg.norm):
    return _norm(pointA - pointB, axis=1)
The constructor method of KNNeighbors. k is the number of neighbors,
and formula is the distance formula that will be used to calculate, well,
the distance to each point.
class KNNeighbors:
    def __init__(self, formula=distance, k=1):
        self.formula = distance
        self.k = k
The fit(points, classes) method accepts both Pandas DataFrames and NumPy arrays.
def fit(self, points, classes):
    try:
        self.points = points.values.reshape(-1, points.shape[1])
        self.classes = classes.values.reshape(-1, 1)
    except:
        self.points = points.reshape(-1, points.shape[1])
        self.classes = classes.reshape(-1, 1)
This function is where all the magic happens. I’ll break down every line, because I shoved as much stuff into them as possible.
This line both calls the formula on the point,
and also builds an array with the values arranged like ['x', 'y', 'dist', 'class'].
def predict(self, point):
    distances = np.hstack((self.points,
                           self.formula(self.points, point).reshape(-1, 1),
                           self.classes))
These two lines (I know, I lied) put the array into a Pandas DataFrame, then sorts the values using Pandas… because I couldn’t figure out how to do it with NumPy.
This sorts the points from closest to farthest.
    distances = pd.DataFrame(data=distances, columns=['x', 'y', 'dist', 'class'])
    distances = distances.sort_values(by='dist')
This line takes the closest k values,
and returns the majority classification using Pandas’ value_counts.
    classification = distances.iloc[:self.k]['class'].value_counts().index[0]

    return classification
Now, an interesting comparison between my KNN model and the sk-learn KNN model.
My model is slower because I didn’t think in 3 dimensions,
so you can only input one point at a time into the predict method.
It’s astronomically slow calculating the distance for every point, instead of them all together.
But the real kicker here is…
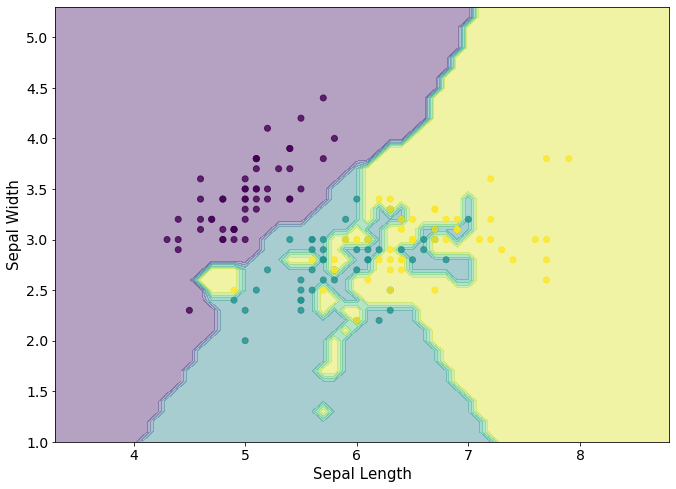
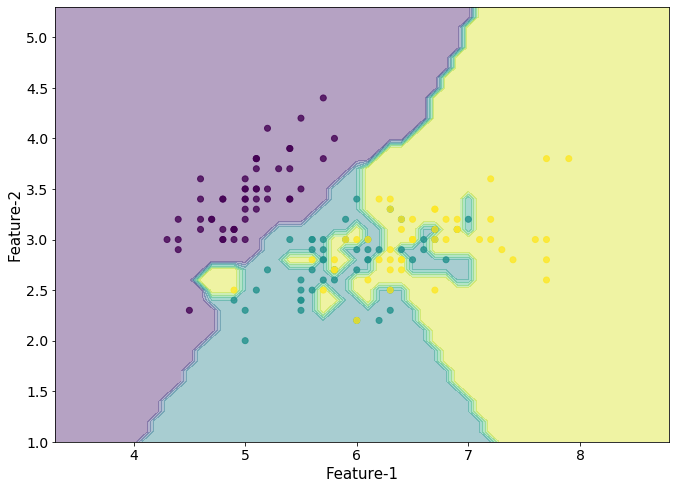
the k = 1 decision boundaries are different between my model and sk-learn.
I used the function I found here to visualize the models (modified significantly when working with my model).
I used the Iris dataset, which can be directly found here.
My classifier

Scikit Learn’s classifier

As you can see, they’re almost the same except for some arbitrary differences.
Only a few regions are noticeably changed between the two, and that might be because I had to edit the visualizing function to display my model.
Conclusion
My biggest takeaway is I don’t understand 3D matrix math.
Alright, that was a lie. My biggest takeaway is how simple the KNN algorithm really is.
If I were to continue working on this project, I would implement the Hart algorithm to optimize prediction runtime. I would also implement inputting any number of points with any number of dimensions.
The full code can be found in the GitHub, and as always, thanks for reading.